Defining Productivity in Agile Methodology
Agile methodology is a framework that emphasizes adaptive planning, continual improvement, and rapid delivery. It is a project management approach that is applicable to both software development and other industries. As it stands, productivity in agile methodology is no longer about measuring the amount of work done but rather the value that is delivered. So, what is productivity in agile methodology?
Productivity in agile methodology is a measure of team productivity based on the ability to deliver valuable and high-quality software products. It is not about getting as much work done as possible but rather delivering a working software that customers find valuable and are willing to pay for.
There are various metrics that teams can use to measure productivity in agile methodology. However, it’s essential to note the importance of selecting the relevant metrics that align with the team’s objectives. Metrics can be categorized into four types: customer satisfaction metrics, velocity metrics, quality metrics, and financial metrics.
Customer Satisfaction Metrics
Customer satisfaction metrics are essential in measuring productivity in agile methodology. Customer satisfaction metrics refer to the level of customer satisfaction with the product and the development process. It is crucial to ensure that the team is building what the customer wants, and this is where customer satisfaction metrics come in.
To measure customer satisfaction metrics, teams can use surveys and feedback from customers. A useful metric that can be used in measuring customer satisfaction is Net Promoter Score (NPS). NPS is a metric that calculates how likely customers are to recommend a product or service to others. It is an excellent measure of customer loyalty and satisfaction.
Velocity Metrics
Velocity in agile methodology refers to the total amount of work that a team completes in a given sprint. Velocity metrics are useful in measuring productivity in agile methodology because they help teams estimate how much work they can complete in a sprint accurately. By using velocity metrics, teams can plan sprints better and deliver products to customers faster.
Velocity metrics can be calculated by dividing the number of completed user stories by the number of sprints. Velocity metrics are useful in keeping track of how much work has been done and how much work remains.
Quality Metrics
Quality metrics are essential in measuring productivity in agile methodology. Quality metrics refer to the level of defects in the code, the speed of resolving defects, and the level of code coverage. Ensuring that the code is of good quality is essential in delivering value to customers.
Quality metrics can be measured by using code analysis tools, conducting code reviews, and using test automation tools. Quality metrics are essential in ensuring that products are delivered on time and are of high quality.
Financial Metrics
Measuring productivity in agile methodology does not only involve delivering value to customers but also ensuring that the organization is making a profit. Financial metrics refer to the financial value that the team generates for the organization.
Financial metrics can be measured using a cost-benefit analysis, return on investment (ROI), and net present value (NPV). Financial metrics are useful in measuring value to the organization and ensuring that the team is delivering a positive return on investment.
In conclusion, productivity in agile methodology is not about measuring the amount of work done but rather the value that is delivered. Teams can use various metrics to measure productivity, but it’s essential to select the relevant metrics that align with the team’s objectives. Measuring productivity in agile methodology involves customer satisfaction metrics, velocity metrics, quality metrics, and financial metrics, all of which are essential in delivering value to customers and the organization.
Key Metrics to Measure Team Productivity
Measuring team productivity has long been a challenge in traditional project management. However, in agile methodology, there are several key metrics that can be used to track team performance. These metrics not only help to identify areas of improvement but also provide insights that enable project managers to make data-driven decisions. Below are some of the key metrics to measure team productivity in agile.
1. Velocity
Velocity is the most commonly used metric in agile. It measures the amount of work a team completes in each sprint. Velocity is calculated by adding up the effort estimates of all the user stories completed in a sprint. This metric helps to track the team’s progress and also provides an estimation of how much work they can complete in future sprints. By monitoring velocity, project managers can identify bottlenecks and determine the team’s capacity, allowing them to plan future sprints accordingly.
2. Cycle Time
Cycle time is the time it takes to complete a user story from start to finish, including development, testing, and deployment. It measures the efficiency of the team’s development process. It does not include waiting time between stages or intervention from outside parties. By monitoring cycle time, project managers can identify areas where the team can improve and optimize the development process.
There are several ways to measure cycle time, but the most common method is through the use of a cumulative flow diagram. This diagram tracks the number of user stories in each stage of development over time. By analyzing the diagram, project managers can identify bottlenecks and improve the team’s workflow.
3. Lead Time
Lead time is the time it takes to complete a user story from the time it is created until it is delivered to the customer. It measures the entire process, including waiting time between stages, and intervention from outside parties. This metric helps project managers to identify the overall efficiency of the development process and make improvements to deliver work faster and get feedback sooner.
To measure lead time, project managers can use the timeline feature on their agile tool. This feature tracks the creation date of a user story and the date it is marked as done. By analyzing this data, project managers can identify areas where the process can be optimized.
4. Burndown Chart
A burndown chart is a graphical representation of the amount of work remaining versus time. It helps project managers to monitor the progress of the team and anticipate the completion date of a project. The chart shows how much work is left to be done in each sprint, and the rate at which the team is completing it. If the burndown line is above the ideal line, it shows that the team is falling behind schedule and needs to speed up.
By analyzing the burndown chart, project managers can determine the team’s pace, improve the team’s estimation skills and identify potential risks.
5. Quality Metrics
Quality metrics are a set of metrics used to track the quality of the product delivered by the team. These metrics include the number of defects, rate of defect removal, customer satisfaction, and user experience. By tracking these metrics, project managers can ensure that the product delivered meets the customer’s requirements and that the team is building a high-quality product.
With agile methodology, measuring productivity becomes easier and more effective through metrics. Measuring these key metrics along with being determined to achieve common goals regardless of hierarchy can lead to improved productivity. Measuring productivity of a team is important in making informed decisions on how agile teams can improve productivity and achieve a successful outcome.
Utilizing Burn-Down Charts for Agile Productivity Monitoring
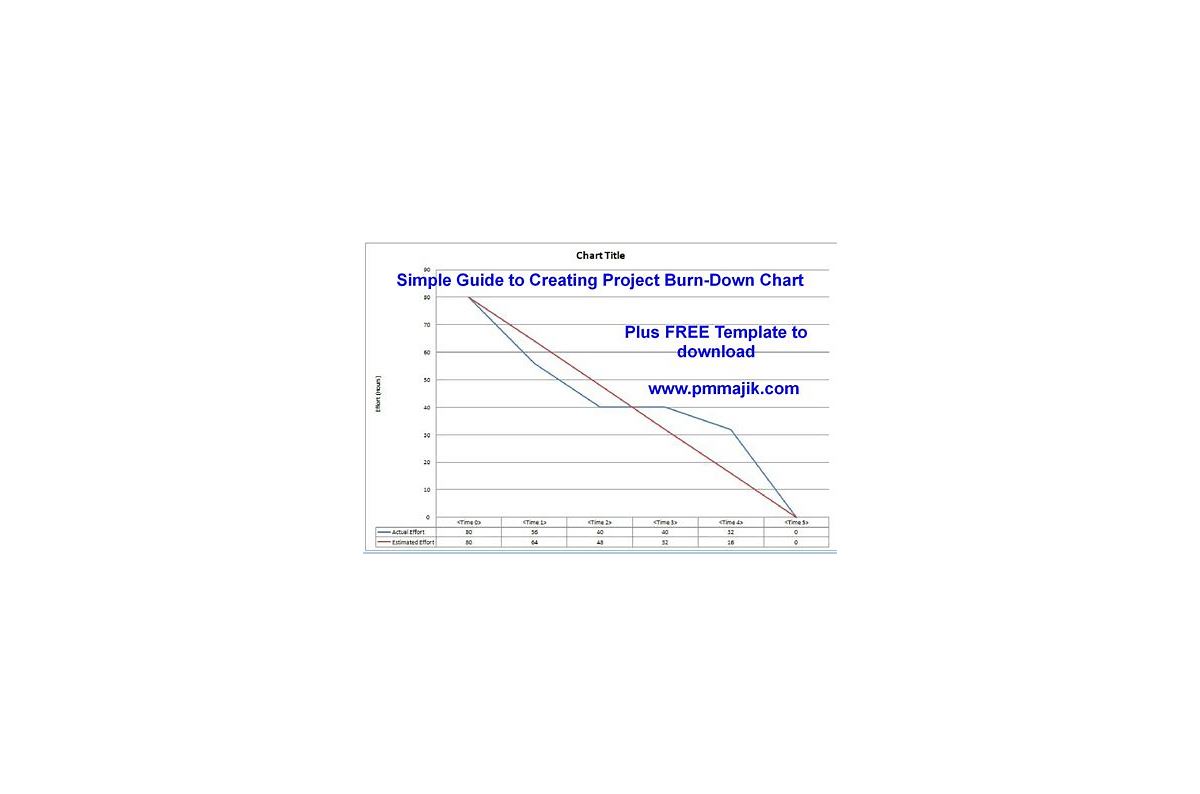
One of the most popular tools to measure productivity in agile is the burn-down chart. A burn-down chart is a visual representation of the team’s progress during a sprint or iteration. The chart shows the amount of work that still needs to be completed (y-axis) against time (x-axis).
The ideal line on the chart is a straight line that starts at the top of the y-axis and ends at the bottom of the y-axis at the end of the sprint. This line represents the team’s planned progress. As the team completes tasks, the line should decrease until it reaches the bottom of the y-axis at the end of the sprint.
There are two types of burn-down charts: task burn-down charts and story burn-down charts. A task burn-down chart shows the progress of completed and remaining tasks during the sprint. A story burn-down chart shows the progress of completed and remaining stories (or features) during the sprint.
Task burn-down charts are useful for tracking progress at the task level. They show the team how much work has been completed and how much work is still remaining. This information can help the team adjust their plans and estimates to ensure they complete the sprint on time.
Story burn-down charts are useful for tracking progress at the story level. They show the team how much work has been completed and how much work is still remaining for each story. This information can help the team identify stories that are at risk of not being completed on time.
Both types of burn-down charts provide valuable insights into the team’s progress. They help identify potential problems early, such as incomplete tasks or stories that may cause delays. By reviewing the charts regularly, the team can adjust their plans and work to ensure they deliver the sprint on time.
Another benefit of burn-down charts is that they facilitate communication within the team. By reviewing the chart together, team members can identify areas where they need to collaborate more effectively to ensure the sprint is completed on time.
Finally, it’s important to note that burn-down charts should be used as a tool for monitoring progress and not as a way to measure individual performance. The focus should always be on team progress and delivering business value.
In conclusion, burn-down charts are an essential tool for measuring productivity in agile. They provide valuable insights into the team’s progress, facilitate communication within the team, and help identify potential problems early. By using burn-down charts regularly, agile teams can adjust their plans and work to ensure they deliver value to the business on time.
Continuous Improvement of Productivity Through Retrospectives
Agile methodology promotes continuous improvement, and this is true not only for the development process but also for productivity. One of the essential tools that Agile teams use to achieve this improvement is the retrospective.
A retrospective is a meeting held at the end of each iteration where the team analyzes the previous iteration’s processes, practices, and results to identify what went well, what didn’t go so well, and what can be improved. It is a chance for the team to reflect on their performance, identify areas for improvement, and create action items to make those changes in the next iteration.
The retrospective is a crucial element of Agile because it helps teams to:
- Identify areas for improvement:
- Promote team collaboration:
- Measure productivity:
- Boost team morale:
By reflecting on the previous iteration, the team can identify potential bottlenecks or barriers that hinder productivity. This reflection helps to raise awareness of where they need to focus their efforts to achieve better results in the future.
The retrospective is a team meeting that encourages collaboration between team members. The team investigates issues together, shares feedback, and collaboratively works on a solution. This process promotes transparency and a culture of continuous improvement in the team.
By analyzing the previous iteration’s results, the team can measure its productivity against targets set for that iteration. This measurement helps the team to identify whether they are on track to achieve their goals and make course corrections before it’s too late.
The retrospective meeting is a chance for team members to celebrate their successes, which boosts morale and motivation. Additionally, by focusing on continuous improvement, it creates a culture of experimentation and feedback, where team members feel comfortable sharing their opinions and ideas.
Retrospectives take many forms, but the goal is always the same – to improve productivity. Here are some best practices for running effective retrospectives:
- Hold the retrospective at the same time and place:
- Keep the meeting short:
- Create a safe space:
- Assign a facilitator:
- Create an action plan:
Hold the retrospective at the same time and place for each iteration to encourage attendance and reduce the need for scheduling conflicts.
Retrospectives should be no longer than one hour to ensure that participants stay focused and engaged throughout the discussion.
It is crucial to create a safe space to encourage open dialogue. Retrospectives should be a no-blame environment where team members can share their opinions freely without fear of retribution.
A good facilitator keeps the discussion centered and focused on the goal of improving productivity. The facilitator should summarize team discussion, ensure that all participants have a chance to speak, and guide the team towards actionable items.
The retrospective should end with creating an action plan outlining what the team will do differently in the next iteration. The action items should be specific, measurable, and achievable.
In conclusion, the retrospective is an essential tool for Agile teams to continuously improve their productivity. The retrospective provides a space for the team to reflect on their performance, celebrate successes, identify areas for improvement, and create actionable items for the next iteration. Retrospectives should be a regular part of an Agile team’s routine and should follow best practices to ensure an effective discussion that leads to tangible results.
The Importance of Tracking Individual Contribution Towards Productivity
Agile is a project management approach that emphasizes teamwork, collaboration, and adaptability. It relies on continuous improvement, feedback loops, and quick iterations to deliver high-quality software products. Productivity in agile teams is an important metric that can measure the efficiency, effectiveness, and output of the team over time. However, measuring productivity in agile can be challenging, especially if the team does not track individual contributions.
The importance of tracking individual contribution towards productivity in agile cannot be overstated. In fact, individual contribution is one of the key factors that determine the success of an agile team. Each team member has a unique set of skills, knowledge, and expertise that they bring to the table. By tracking individual contributions, teams can identify the strengths and weaknesses of team members, allocate tasks and responsibilities more effectively, and optimize team performance.
Here are five reasons why tracking individual contribution towards productivity is crucial in agile:
1. Improved accountability
Tracking individual contribution helps team members hold each other accountable for their work. When each team member understands the role they play in achieving the team’s goals, they are more likely to take ownership of their work and deliver it on time and to a high standard. Moreover, when team members know that their contributions are being tracked, they are more likely to be motivated to perform at their best.
2. Better resource allocation
Tracking individual contribution also enables teams to allocate resources more effectively. By understanding the skills and expertise of each team member, the team can assign tasks and responsibilities that play to their strengths. This optimizes productivity, minimizes wasted time and effort, and ensures that the team is making the most of its resources.
3. Enhanced team performance
Tracking individual contribution can also boost team performance. By identifying the strengths and weaknesses of each team member, the team can provide targeted training and support to help team members improve their skills. This promotion of personal development can lead to a positive shift in team dynamics, increased collaboration, and better overall performance.
4. Increased transparency
Tracking individual contribution also promotes transparency among team members. When everyone understands the role they play and the value they bring to the team, they are more likely to work together in a collaborative and supportive environment. This enables the team to identify and solve problems more effectively and make changes more quickly in response to feedback.
5. Better decision making
Finally, tracking individual contribution can lead to better decision making. By understanding the strengths and limitations of each team member, the team can make informed decisions about how to best allocate resources, assign tasks, and prioritize work. This can ensure that the team is working towards its goals efficiently and effectively and that everyone is working towards a common purpose.
In conclusion, tracking individual contribution towards productivity is a key factor in the success of an agile team. By promoting accountability, resource allocation, team performance, transparency, and decision making, teams that track individual contribution can optimize their performance and achieve their goals more effectively.

What Effect Does Chocolate Have On Dogs

Low Sodium Levels In The Elderly Symptoms